

Whether you are a novice crypto trader or new to the world of crypto, we can guarantee that at some point in your early days of following the crypto space, you must have heard of support and resistance levels on a crypto chart. Support and Resistance are two of the most basic and essential concepts in technical analysis.
By basic, we don’t mean that they are simple to draw, but that they are one of the most common tools used for technical analysis. They represent a price level at which the trend of a cryptocurrency might reverse, pause, stabilize, or even break through it to strengthen the direction of the movement further. Traders often consider these levels as a point where they make their buying or selling decisions.
Factors Influencing Support and Resistance
Support and Resistance levels are not just random lines drawn on the chart to mark the points where the trend on a crypto chart will change. Market trends, psychological factors, and the basic economic principle of supply and demand influence them.

When a price approaches a support level, it is an indication to the buyers that the asset may be undervalued, and this might be the ideal point to enter the market, creating upward pressure. On the other hand, when support reaches the resistance level, then the sellers perceive the asset as overvalued, and now might be a good time to sell it to maximize profits before the investment starts to lose its value.
In the history of cryptocurrency trading, several instances stand out where support and resistance played pivotal roles. For example, Bitcoin’s price hovering around the $6,000 mark in 2018 acted as a significant support level after a bear market. Its failure to breach this support marked a prolonged consolidation phase before a bullish breakout.
Relevance in Technical Analysis
Support and resistance are key elements of technical analysis. Traders use tools such as trendlines, moving averages, and chart patterns to identify and confirm these critical levels. When these tools validate the support or resistance level, it strengthens the trader’s confidence in the decision-making process.
The concept of support and resistance is not limited to a one-time frame. You can map out support and resistance levels on various time frames depending on whether you are planning for a long-term investing opportunity or short-term trading gains. Since they can be adapted according to any time frame, they are considered as one of the most important tools on which you base your buying and selling decision on a crypto asset.
Identifying different support and resistance levels is of utmost importance to crypto traders and investors as they also form a part of your risk management strategy and setting of your price targets that should be achievable. They help you make informed decisions and prevent you from sustaining losses that you might or might not recover from.
Understanding Support in Crypto Trading
Support levels are vital markers in the cryptocurrency market that signify a point where downward price movements often pause, stabilize, or potentially reverse. Understanding these levels is crucial for traders looking to make informed decisions.
Definition of Support
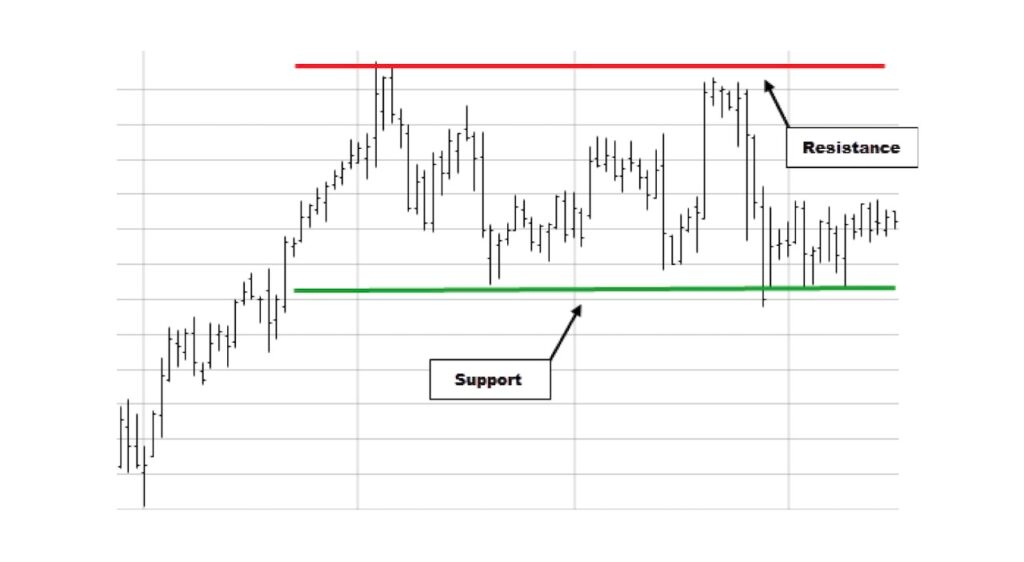
In crypto trading, a support level is a price point at which the demand for an asset is sufficiently strong to prevent the price from declining further. If you look at charts where support levels are mentioned, you will see that they are acting as a floor where the price will stop going further downward and instead bounce back up. This level serves as an entry point for traders and investors alike.
Formation of Support Levels
Support levels are not formed at random; rather, they are formed due to the collective perception of everyone participating in the crypto market. When the price of a crypto asset approaches a certain level, buyers start to think that this is the lowest level that the cryptocurrency can reach at this point, and in fact, they view it as being undervalued.
When an asset becomes undervalued, its demand increases because people see the potential of getting good returns once they buy it on the low, and the cryptocurrency starts to increase in value due to increased demand. This surge in buying activity halts the downtrend, leading to a temporary or sometimes prolonged pause in the price decrease.
Let’s consider the historical price action of Ethereum (ETH) in 2021. During a substantial market correction, ETH consistently found support around the $2,000 mark. Traders observed increased buying activity each time the price approached this level, preventing it from dipping further and allowing for a subsequent upward movement.
Strategies for Identifying Support Levels
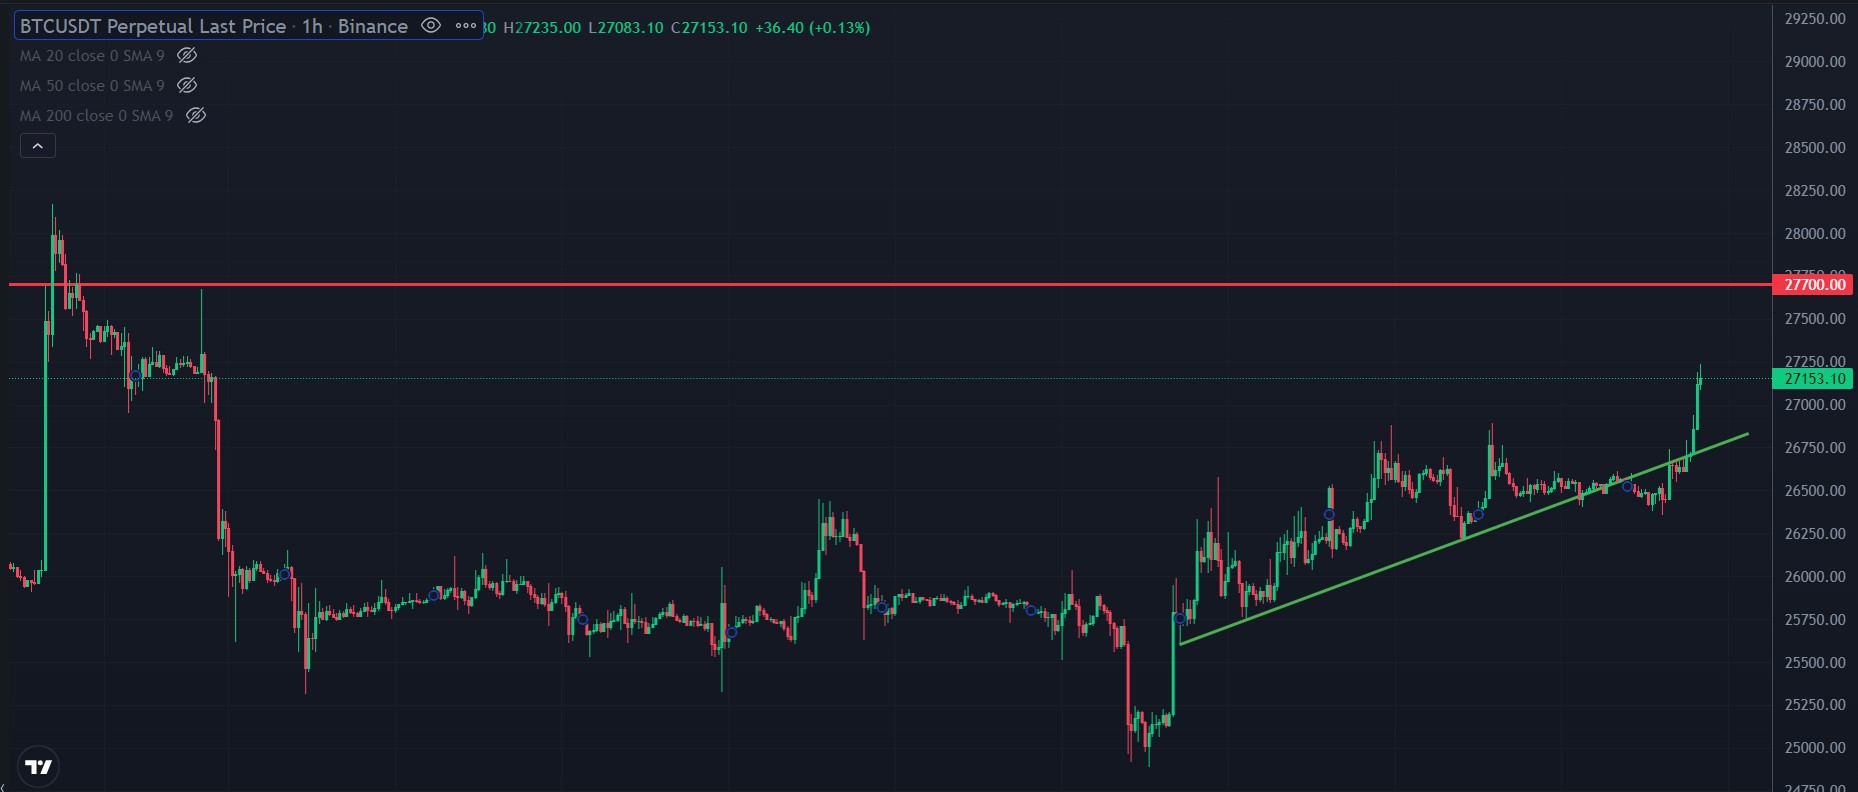
To identify support levels on a cryptocurrency chart, traders employ various tools to determine the next support level. One common approach is using technical analysis tools like drawing horizontal trendlines or calculating moving averages.
These tools help traders pinpoint the price where the buying activity has been historically more prominent, and this price level indicates that this is the probable support level from where the cryptocurrency can potentially bounce upwards. Some traders also rely on significant round numbers or psychological price levels that often act as strong support, considering the human tendency to perceive these levels as crucial turning points.

Utilizing Support in Trading Strategies
Identifying support levels helps traders to make their next trading strategies. They can use these levels to place a stop-loss order so that they may save themselves from incurring further loss due to the falling price of a cryptocurrency, or they can also do dollar-cost averaging at this level by adding more funds to minimize the overall decrease in the value of the crypto asset that they are currently holding in their portfolio.
If they are not satisfied with either one of these cases, then they can close the position and open a new post from the support level, hoping that the price will move upwards from here and they can recover their losses or gain more profit.
Understanding Resistance in Crypto Trading
Just as support levels tell you that the cryptocurrency price is undervalued, and the chances are that the trend may see a reversal when it reaches the support level, the resistance levels do the exact opposite of that. Resistance levels are pivotal points that signify a level where the upward price movement of a cryptocurrency often stalls, which means that the cryptocurrency is facing selling pressure. We might face a scenario where the price will be reversed.
Definition of Resistance
In cryptocurrency trading, a resistance level is a price point at which the selling pressure for an asset is strong enough to prevent the price from rising further. It acts as a ceiling where sellers tend to enter the market, increasing the selling pressure and preventing the price from surpassing that level.
Formation of Resistance Levels
Similar to support, resistance levels are formed when the collective decision of the market highlights the fact that a cryptocurrency has seen a sufficient increase in its price, and now it is overvalued. This causes the sellers to start selling the cryptocurrency, which in turn increases selling pressure, and as a result, the value of the crypto asset starts to fall downward as the uptrend is halted.
Consider the historical price action of Ripple (XRP) in a specific bull run. XRP consistently encountered resistance around the $1.50 mark. Traders observed increased selling activity each time the price approached this level, preventing it from surpassing further and leading to subsequent downward movements.
Strategies for Identifying Resistance Levels

To identify support levels on a cryptocurrency chart, traders employ various tools to determine the next resistance level. Just like in the case of establishing a support level, technical analysis tools such as horizontal trendlines, moving averages, and analyzing chart patterns help in identifying the next resistance level where historically the pressure of selling is high or where selling activity has been very prominent.
Additionally, psychological price levels, or round numbers, are often seen as significant resistance levels due to the tendency of traders to perceive these levels as crucial points for taking profits or selling positions.
Utilizing Resistance in Trading Strategies
Identifying support resistance levels helps traders to make their next trading strategies. They can use this level to place a take-profit order, which means that when the cryptocurrency reaches the resistance level, an automatic sell order will be executed, and the trader bags profit from trading this crypto asset and has now closed his position.
Traders can also consider the potential end of bullish trends when resistance levels hold firm, which can also be the start of a bearish trend. Still, it depends on other factors as well, and you cannot just use support or resistance levels to identify the change in trends.
Importance of Support and Resistance in Crypto Trading
Support and Resistance levels are like traffic signals for traders in the cryptocurrency market, where they give you an indication of when to enter or exit a trade. They also help you in setting safety nets like stop-loss or setting targets where you can execute take-profit. The most important characteristic of support and resistance levels is that they show if the trend on the price chart of a particular crypto asset is getting weaker or growing stronger.
If a cryptocurrency breaks through a support level, then this gives you a very good indication of how the price might go further down. Therefore, you need to reevaluate your trading strategy, like whether you want to wait further for the cost to fall or you have reached the limit of seeing the cost of your crypto asset falling further down and the time is right to exit from the market.

Similarly, suppose the cryptocurrency price breaks through a resistance level. In that case, it shows that the chart is showing promises of more upward movement, and you can relish the chance of gaining more profits on your crypto trade. When many traders focus on the same support or resistance, it can make those levels even more powerful, influencing how the market moves.
Advanced Techniques and Tools
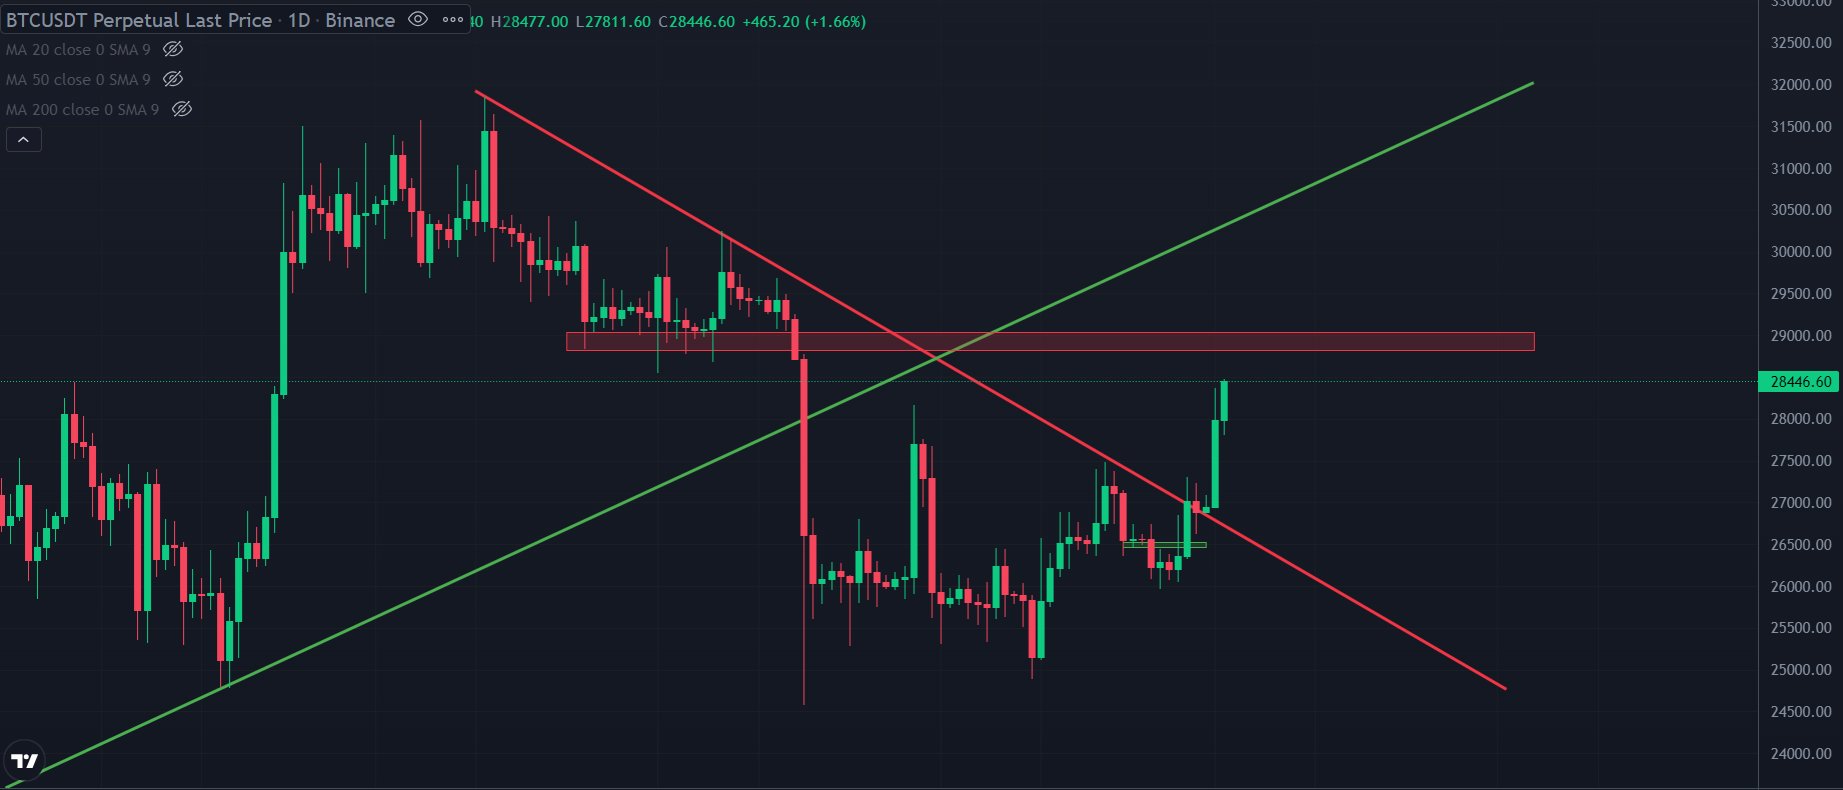
Traders in the crypto market go beyond the basic support and resistance study by using more advanced tools. One such tool is Fibonacci retracement, which relies on special numbers to pinpoint possible turning points in prices. It’s like having markers on a map to predict where the price might change. Moving averages create smoother lines on a chart, giving a clearer view of where prices could head, while trend channels outline wider areas for potential trading ranges.
Additionally, traders often use automated software that quickly spots and confirms these support and resistance levels, acting like a helpful assistant for faster and more accurate analysis. It’s as if they have a smart, fast helper to point out the important bits on the charts, making the trading process smoother.
Conclusion
In conclusion, support and resistance levels are foundational aspects of technical analysis in crypto trading. Recognizing their importance, understanding their formation, and utilizing various tools and strategies are crucial for traders to make well-informed decisions in the volatile and dynamic cryptocurrency markets. By integrating these concepts into trading strategies, traders can effectively manage risk, set realistic targets, and make more precise market predictions, increasing the potential for successful trading outcomes.

