

When it comes to doing chart analysis or technical analysis in cryptocurrency, traders heavily rely on a variety of price indicators which help them in making informed decisions. Cryptocurrency is a very volatile market, and traders and investors alike don’t want to invest blindly without first doing their due diligence and looking at different indicators. These indicators play a pivotal role in helping traders identify trends, potential price reversals, bullish or bearish divergences, etc. Traders, new or experienced, must familiarize themselves with these concepts due to the ever-changing and dynamic landscape of the crypto market.
While there are several indicators available that traders can use to identify the potential trends taking place and how to plan their next move, we will discuss some of the well-known price indicators that you probably would have seen many of the known crypto influencers using in their analysis which they share with their followers on different social media platforms.
From Moving Averages, which smooths out price data to identify trends and support/resistance levels, to the Relative Strength Index (RSI) which gauges the momentum of price movements, each of these tools holds a specific function. Additionally, the MACD, Bollinger Bands, Fibonacci Retracement, and Volume indicator add layers of insight, allowing traders to make informed decisions in an asset class known for its rapid price swings.
Let’s explore the utility of these different price indicators and how they help crypto traders navigate the market.
Moving Averages (MA):
The first tool you would want to have in your arsenal for technical analysis is Moving Averages. When it comes to making sense of the unpredictable and inconsistent of volatile price movement in the crypto market, Moving Averages will help you in smoothing out the numbers and help you in making sense of them.
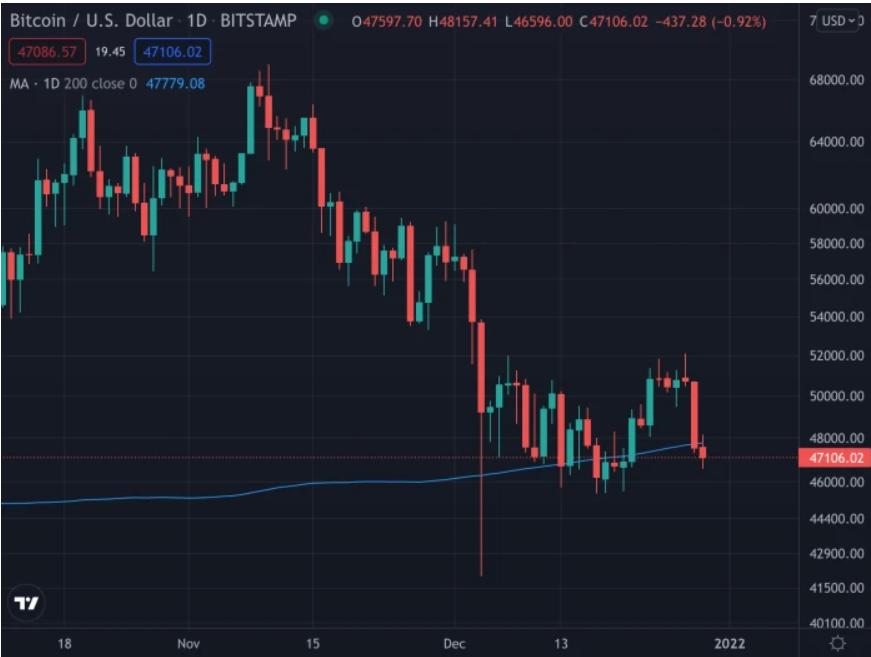

Once the traders can interpret what these movements represent, they can get a better understanding of the direction in which the market is heading. Moving Average can help traders filter out the short-term noise in the market so that they can avoid confusion of following false signals. There are three essential types of Moving Averages.
Simple Moving Average (SMA):
In Simple Moving Average, traders calculate the average price of a cryptocurrency over a specific period by adding the closing prices and then dividing it by the number of periods. This will help the traders in identifying the trends and the support and resistance level. A Simple Moving Average is easy to calculate but it may give you delayed results since they lag behind recent price movements.
Weighted Moving Average (WMA)
In the Weighted Moving average, more emphasis or weight is put on the recent price data and less on the past data. Weighted Moving Averages will give you results closer to real-time compared to Simple Moving Averages. Due to its highly responsive nature to recent price changes, it becomes more useful for traders who are interested in the recent price movements of the crypto market.
Exponential Moving Average (EMA):
Exponential Moving Average is similar to Simple Moving Average, measuring trend direction over some time. The Exponential Moving Average gives more weight to recent price data, making it more responsive to recent price changes. It provides a quicker indication of trend shifts and is popular among short-term traders.
Relative Strength Index (RSI):
Relative Strength Index or RSI is another popular tool used by crypto traders in chart analysis. Using RSI, you can evaluate whether the crypto asset you are planning to trade is overbought or oversold. These calculations are made based on the recent price changes of the crypto asset, the speed with which these price changes are occurring, and the direction in which the asset is taking place on the charts.
The formula to calculate RSI is RSI = 100 – (100/(1+RS)), where RS is Relative Strength. RS is the Relative Strength, calculated as the ratio of average gains to average losses over a specified period.
MACD (Moving Average Convergence Divergence):
The Moving Average Convergence Divergence or MACD is another one of the popular indicators that helps traders identify the current trends of the crypto market. It helps traders by providing them with useful information regarding the relationship between two moving averages of a crypto asset’s price.
MACD consists of three primary components:
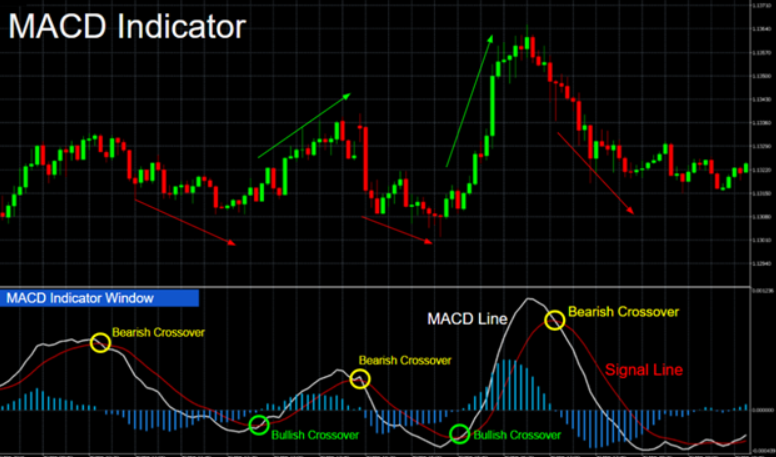
MACD Line:
The MACD line is calculated by subtracting a long-term Exponential Moving Average (EMA) from a short-term EMA. The short-term EMA usually involves a 12-period EMA, whereas the long-term EMA involves a 26-period EMA. The result is a line that reflects the difference between those two EMAs. It is usually helpful for identifying short-term price momentum.
Signal Line:
The Signal Line is calculated as a 9-period EMA of the MACD line. When the MACD moves in the upward direction and crosses the Signal Line, then this gives a Bullish indication of the market. Conversely, when MACD moves in the downward direction and crosses the Signal Line, it gives a Bearish indication of the current market.
Histogram:
The histogram is a graphical representation of the difference between the MACD line and the signal line. What it does is that it provides a visual representation of the difference between the main MACD plot and its signal line. In simpler terms, it helps you identify the MACD’s strength and the direction where it is headed. When the MACD line is above the signal line, the histogram is positive. A positive histogram means that the market is showing bullish momentum. Conversely, if the MACD line is below the signal line, the histogram is negative, which means that the market is showing bearish momentum.
Here’s how the MACD indicator is typically interpreted and used by traders:
Crossovers:
The main purpose of using MACD is to identify the potential trend changes in the cryptocurrency market. When the MACD line crosses above the signal line, and we are getting a bullish signal, then this means that this might be a good time to buy a crypto asset. Similarly, when the MACD line crosses below the signal line, and we are getting a bearish signal, then this means that it might be a suitable time to sell, or if you are not willing to sell, then you can always hold. It all depends on your personal preference and your future goals.

Divergence:
MACD divergence occurs when the MACD indicator’s direction contradicts the direction of the cryptocurrency’s price. For example, if the cryptocurrency’s price is making new highs while the MACD is making lower highs, it could indicate a potential reversal in the trend.
Overbought and Oversold Conditions:
Another use of the MACD indicator is to identify the assets that are overbought or oversold or in the broader picture, to identify the overbought and oversold conditions in the market.
Traders also use MACD to identify overbought and oversold conditions in the market. If the MACD moves significantly above the zero line, it suggests that the cryptocurrency is overbought. This will also indicate that the market is due for a possible correction. Conversely, if it drops well below the zero line, it suggests oversold conditions, and the probability is there for a potential upward reversal.
The MACD indicator is a reliable tool for traders in the cryptocurrency market. Its ability to identify trends, generate buy and sell signals, and spot potential reversals makes it a valuable component of technical analysis.
Bollinger Bands:
Bollinger Bands is used by traders to assess price volatility, identify potential reversal points, and get an understanding of the overall market conditions. This indicator consists of three key components. The middle band (typically a 20-period Simple Moving Average) and two outer bands are placed at a specified number of standard deviations from the middle band.
The middle band, which represents the 20-period SMA, serves as a central reference point. It reflects the average price over the selected time frame. The outer bands are placed above and below the middle band, usually at two standard deviations away. These bands indicate price volatility. When price movements remain within the bands, it suggests lower volatility, while price excursions beyond the bands indicate increased volatility.
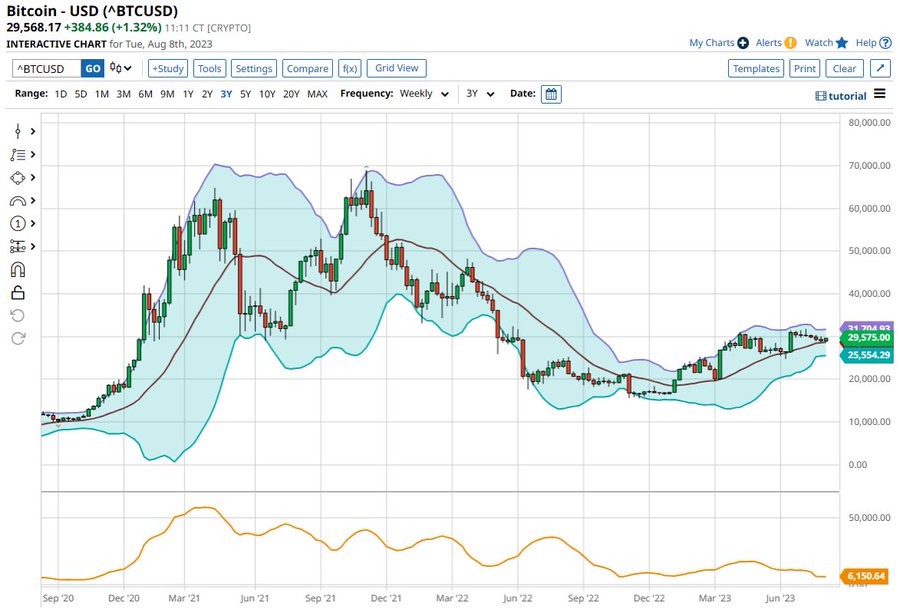
When the price approaches the upper band, it may be considered that the asset is overbought, and a potential reversal or correction is on the horizon. On the other hand, when the price approaches the lower band, it might be it may be considered that a particular asset is oversold, potentially signalling a possible upward reversal.
Traders often use Bollinger Bands along with other technical indicators to validate trading decisions. For example, suppose a cryptocurrency’s price touches the upper band and simultaneously shows bearish divergence on an indicator like the Relative Strength Index (RSI). In that case, it can provide a stronger signal for a potential reversal.
Fibonacci Retracement:
Fibonacci retracement is used to identify potential support and resistance areas in a cryptocurrency’s price chart. Named after the renowned mathematician Leonardo Bonnaci, commonly known as Fibonacci, this tool is based on a sequence of numbers and ratios that occur in various natural phenomena. In cryptocurrency trading, Fibonacci retracement levels are used to gain insights into potential price reversals, corrections, and key price levels. We will look at some of the known aspects of this sequence and how it is used in technical analysis.
The Fibonacci Sequence:
The Fibonacci sequence is a series of numbers where each number is the sum of two of the previous numbers (e.g., 0, 1, 1, 2, 3, 5, 8, 13, 21, and so on). The Fibonacci ratios, derived from this sequence, are the basis of Fibonacci retracement levels.
Key Fibonacci Ratios:
The primary Fibonacci retracement levels are 23.6%, 38.2%, 50%, 61.8%, and 78.6%. These levels represent potential areas of support (if below the current price) or resistance (if above the current price) in a cryptocurrency’s price chart. The 50% level is not derived directly from the Fibonacci sequence but is included due to its historical significance.

Determining Support and Resistance:

To use Fibonacci retracement, traders typically select two extreme points on a price chart, often a recent high and low. Using an analysis tool like TradingView, you can automatically generate the Fibonacci retracement levels, which are applied to the price movement between these two points. The levels represent percentages of the overall price range. Traders often use them to identify potential levels where a cryptocurrency’s price might find support and reverse an ongoing downtrend or encounter resistance and reverse an uptrend.
Traders use Fibonacci retracement levels in combination with other technical analysis tools to confirm potential entry and exit points. For example, if the 61.8% retracement level coincides with a significant support level, it may offer a strong buy signal.
Volume:
The Volume indicator provides traders with valuable insights into the strength of price movements. Volume refers to the total number of tokens or coins traded within a specified time frame, such as 1-hour,4-hour,1-day, etc.
The purpose of this indicator is to assess the strength and validity of price movements. When a certain crypto asset experiences an increase in trading value during an uptrend market condition, then it suggests a strong buying interest. This can also be taken as a bullish sign for the particular crypto asset to remain in an uptrend momentum for a certain amount of time.
The high trading volume during a decline in the price of a particular crypto asset indicates that the selling pressure is high, and a large number of traders are actively selling their holdings. The increased volume during a downtrend is often an early sign that a reversal may be on the horizon.
Volume analysis is particularly useful for confirming trend reversals. For example, when a cryptocurrency’s price experiences a consistent increase, and we see a rise in trading volume alongside it then it indicates that the trend has strong support and is more likely to continue. Conversely, if the volume is high during a downtrend, then it strengthens the case for a potential trend reversal.
Apart from these two scenarios, the third scenario where Volume analysis can prove to be very useful is during periods of price consolidation, where the price of a crypto asset is moving between a very narrow range of numbers. Low volume during consolidation suggests indecision in the market, while a breakout with increased volume can provide a strong signal in either direction.
If a cryptocurrency’s price is rising while volume is declining, it might indicate weakening buying interest and a potential trend reversal. Conversely, if the price is falling while volume is decreasing, it could suggest that the selling pressure is slowing down, and we might see a potential reversal.
Conclusion:
So, there you have it; there are some of the most used and known price indicators that traders use when analyzing the market and making their trading plans. The technical analysis aspect of cryptocurrency is not limited to only these indicators, and there are also other tools available at your disposal to make informed decisions before entering a trade. It is best to use more than one price indicator so that you can make a better decision for your trading career.

